
Simulink is a graphical, block-oriented extension to MATLAB for modeling and simulation of dynamical systems. One of the advantages of Simulink is the ability to model nonlinear systems.
In this blog, you are going to learn how to plot a simple sine wave and modify it inside of Simulink.
Start Simulink 💻
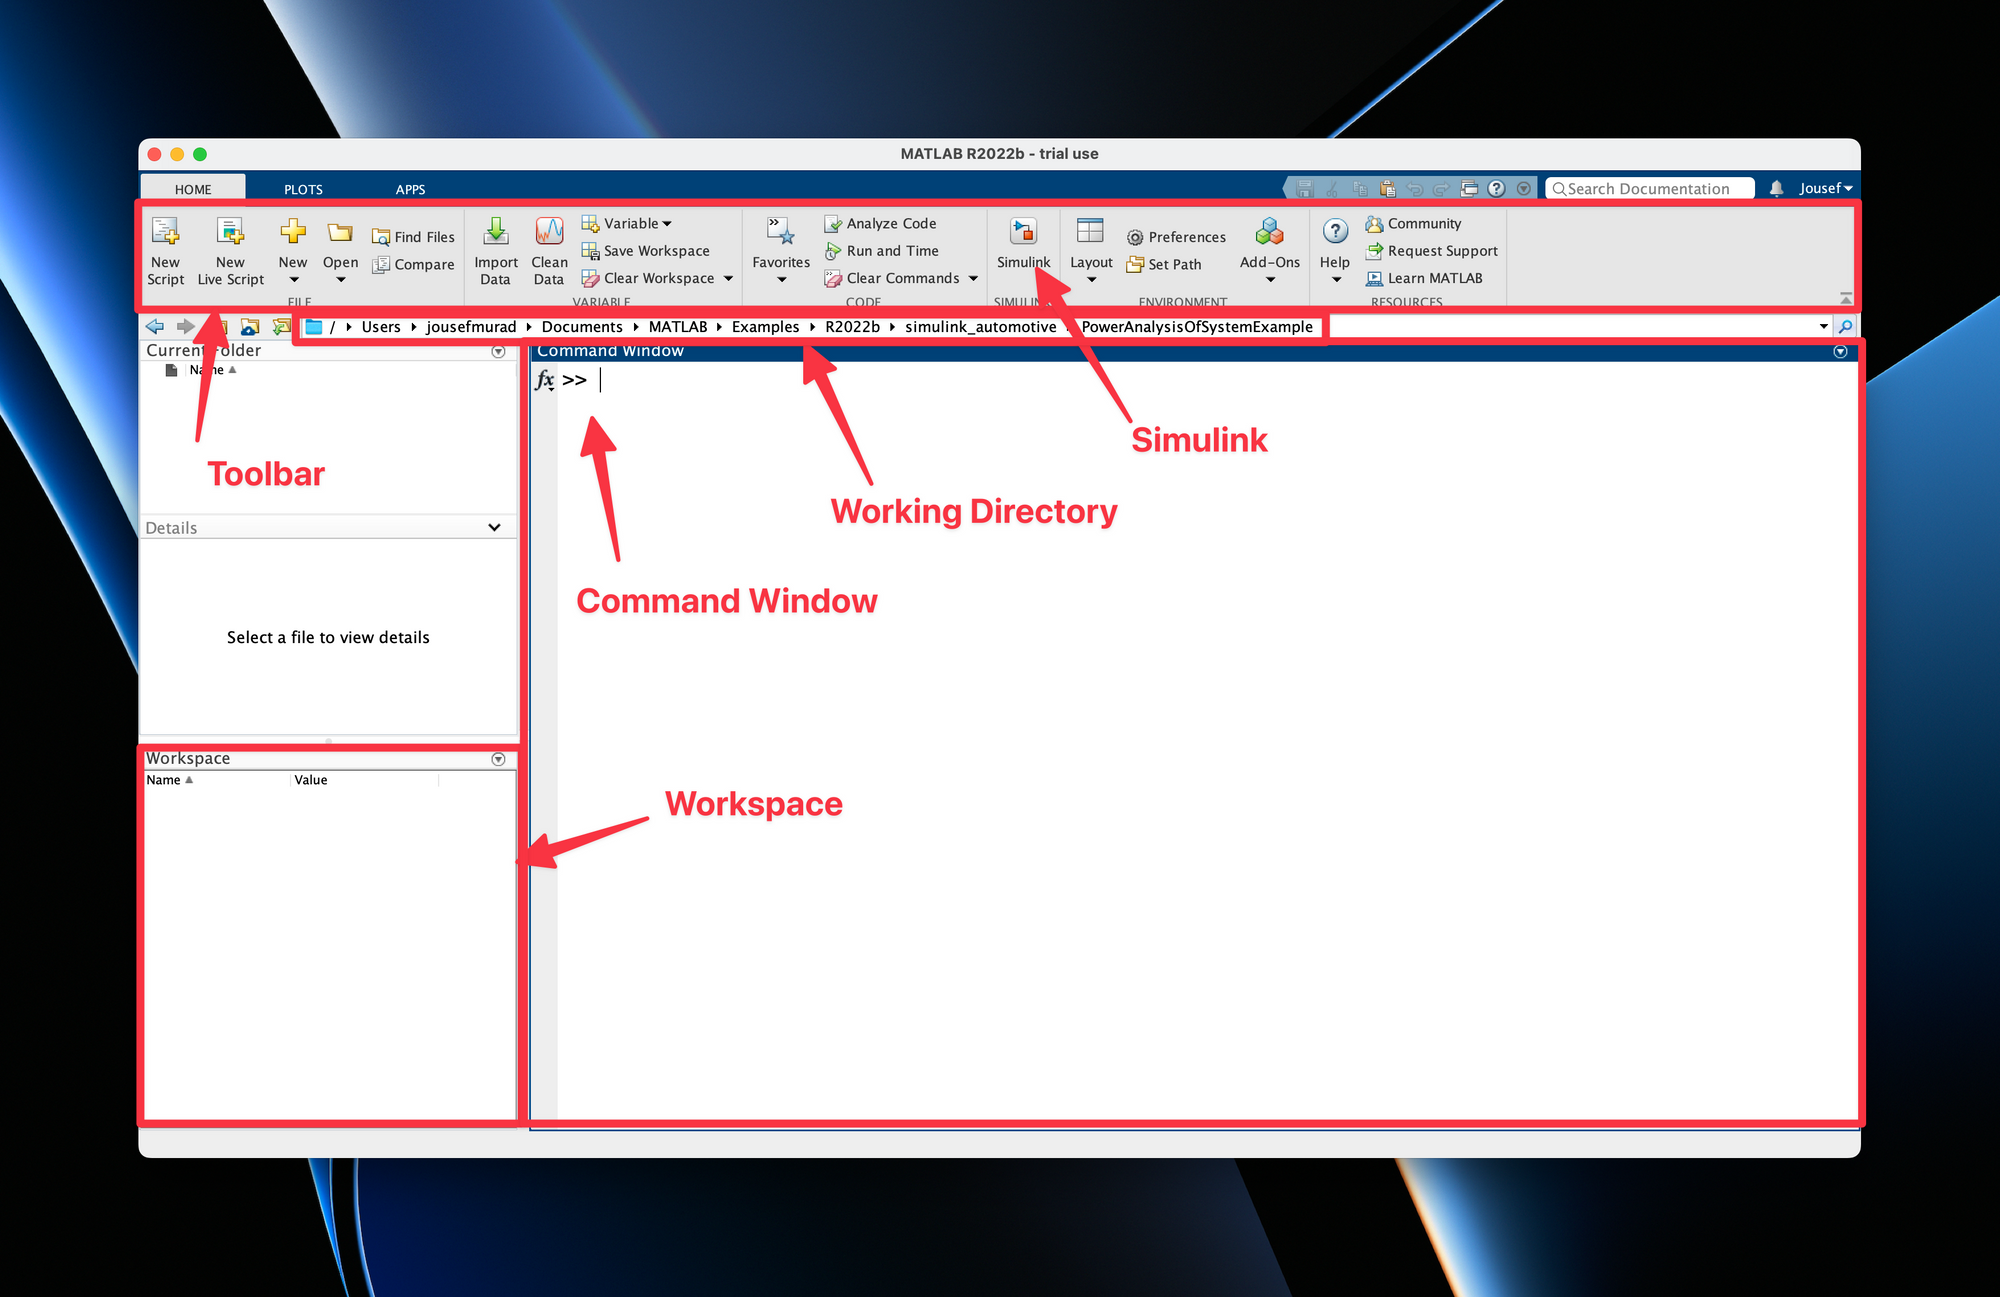
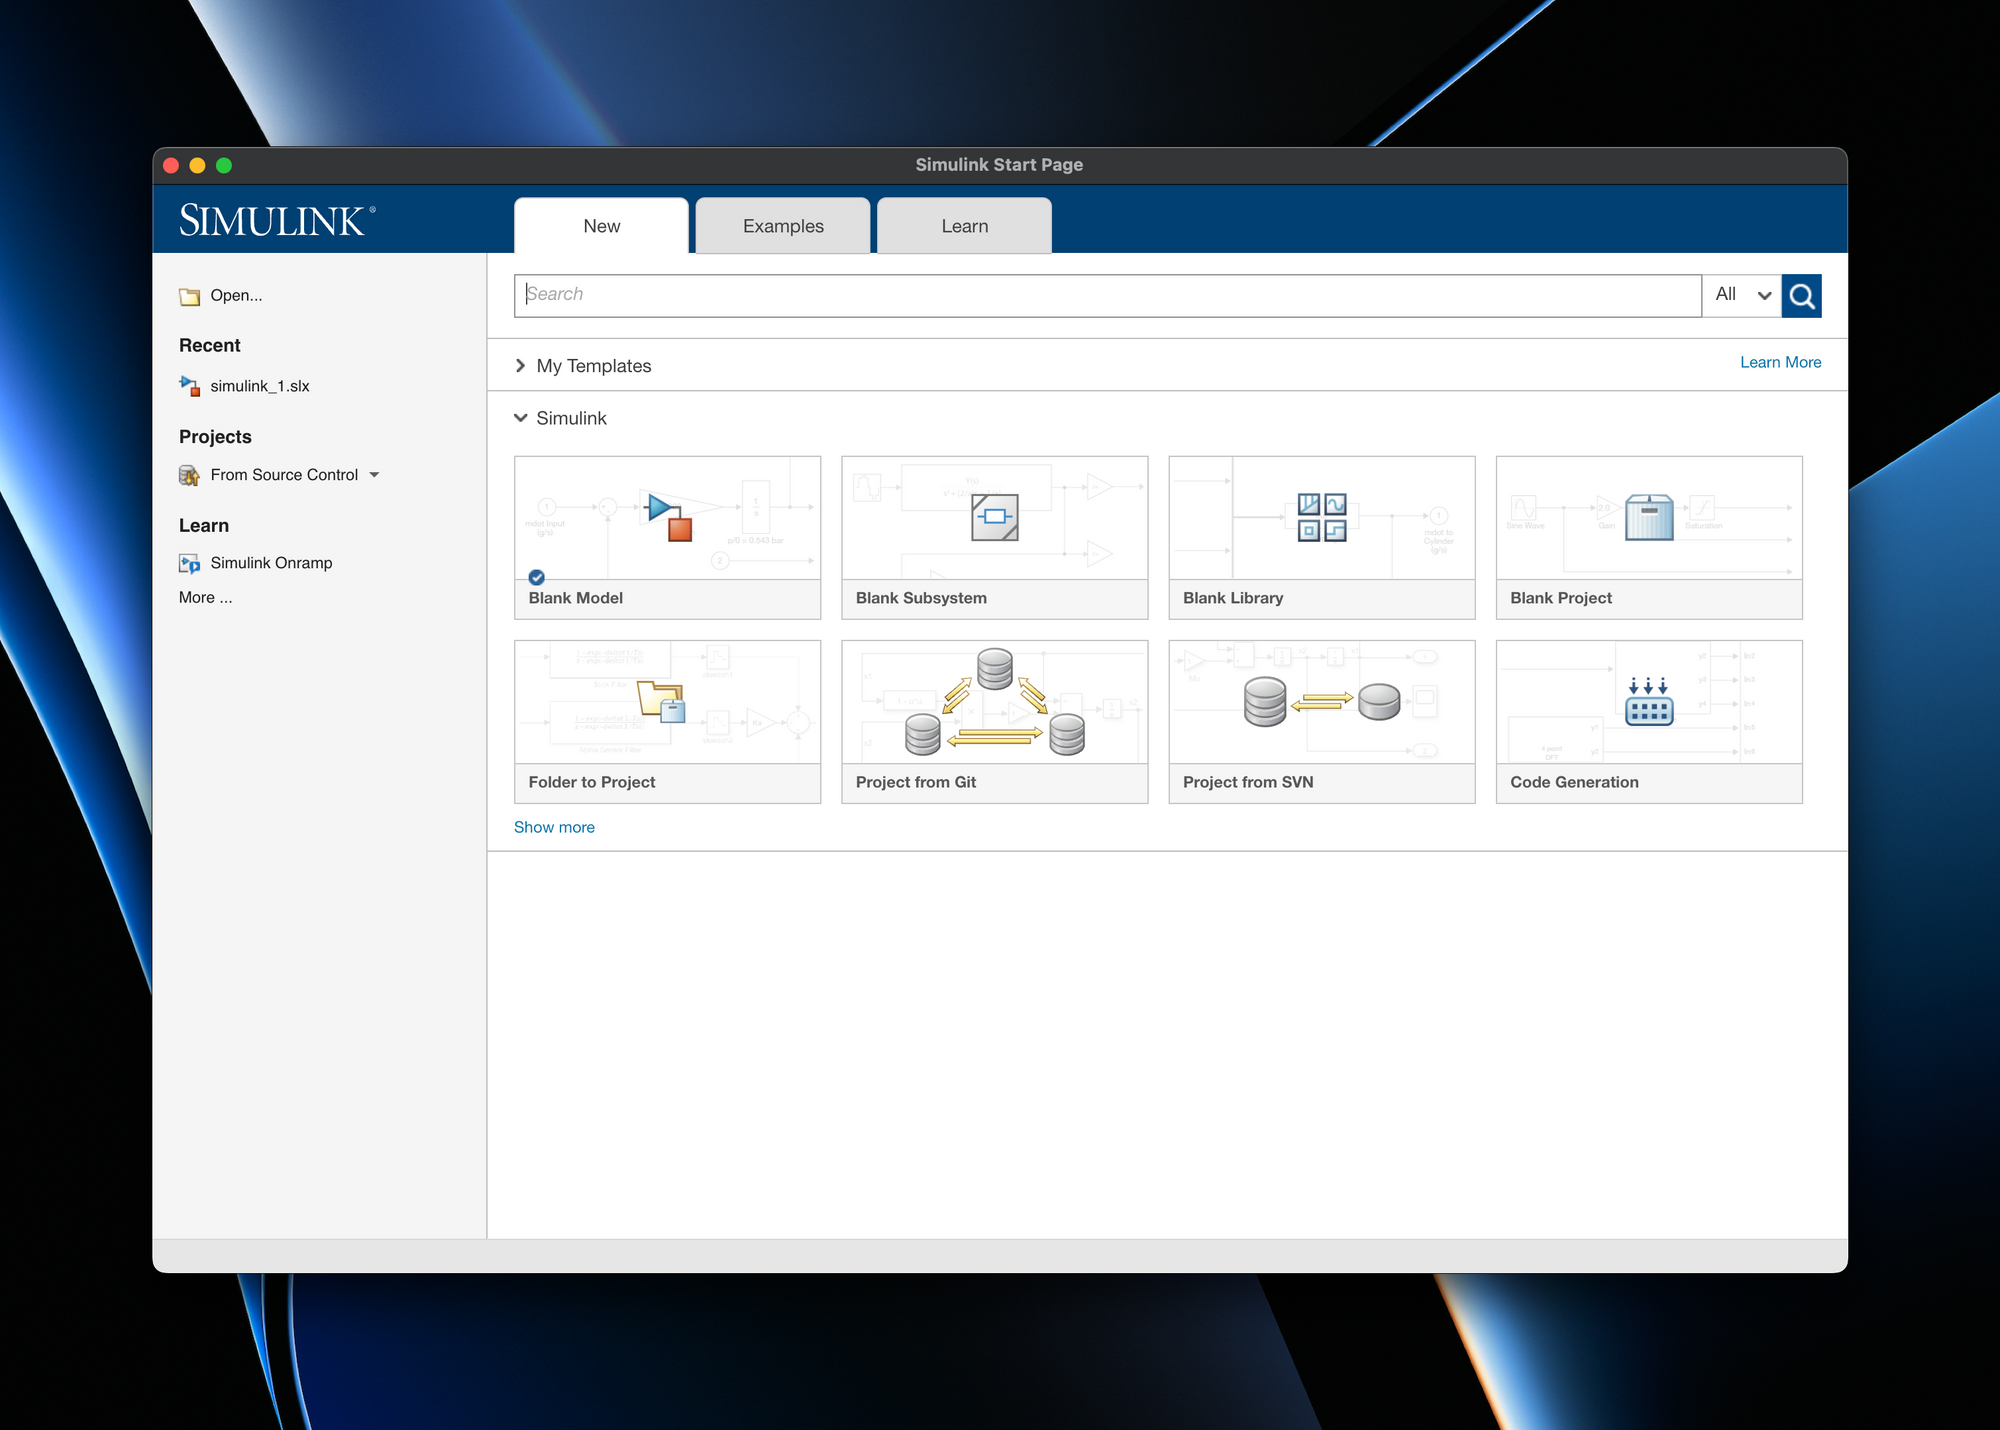
In order to start Simulink, we have to start MATLAB and click on the Simulink icon in the top toolbar. This will open the Simulink with a few options that you can choose from. For this particular tutorial, we will go ahead and start with a blank model to visualise a simple sine wave.
Getting Started 🤓
Once we have chosen a blank model we have a ton of buttons that we can choose from. The goal is to create a simple sine wave, scale the signal and visualise it inside of Simulink.

If you click on Library Browser in the toolbar, you can find all relevant blocks that you want to use. In case you already know the name of the block you can click inside the white space and start typing the block name and Simulink will corresponding elements.
Create Elements 📊
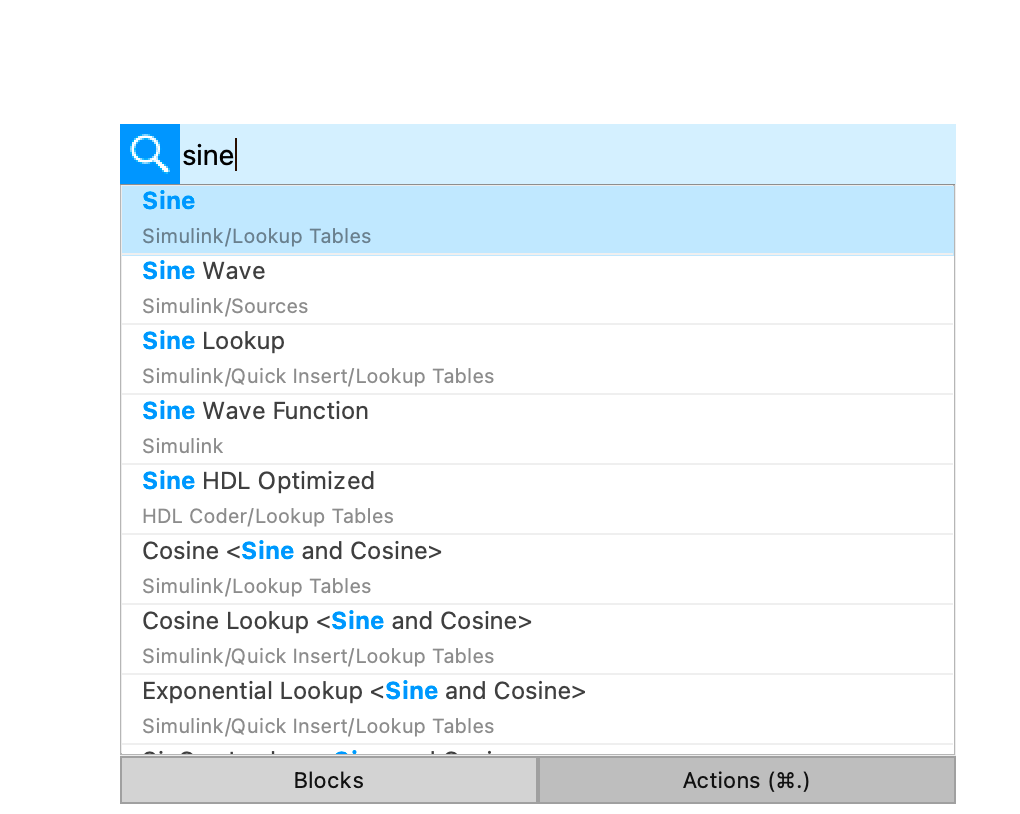
Once we are sure what block to use (Sine Wave), we will simply click on it and it will automatically appear on the screen.
We do the same with a gain element as well as a scope element. The results should look like that:
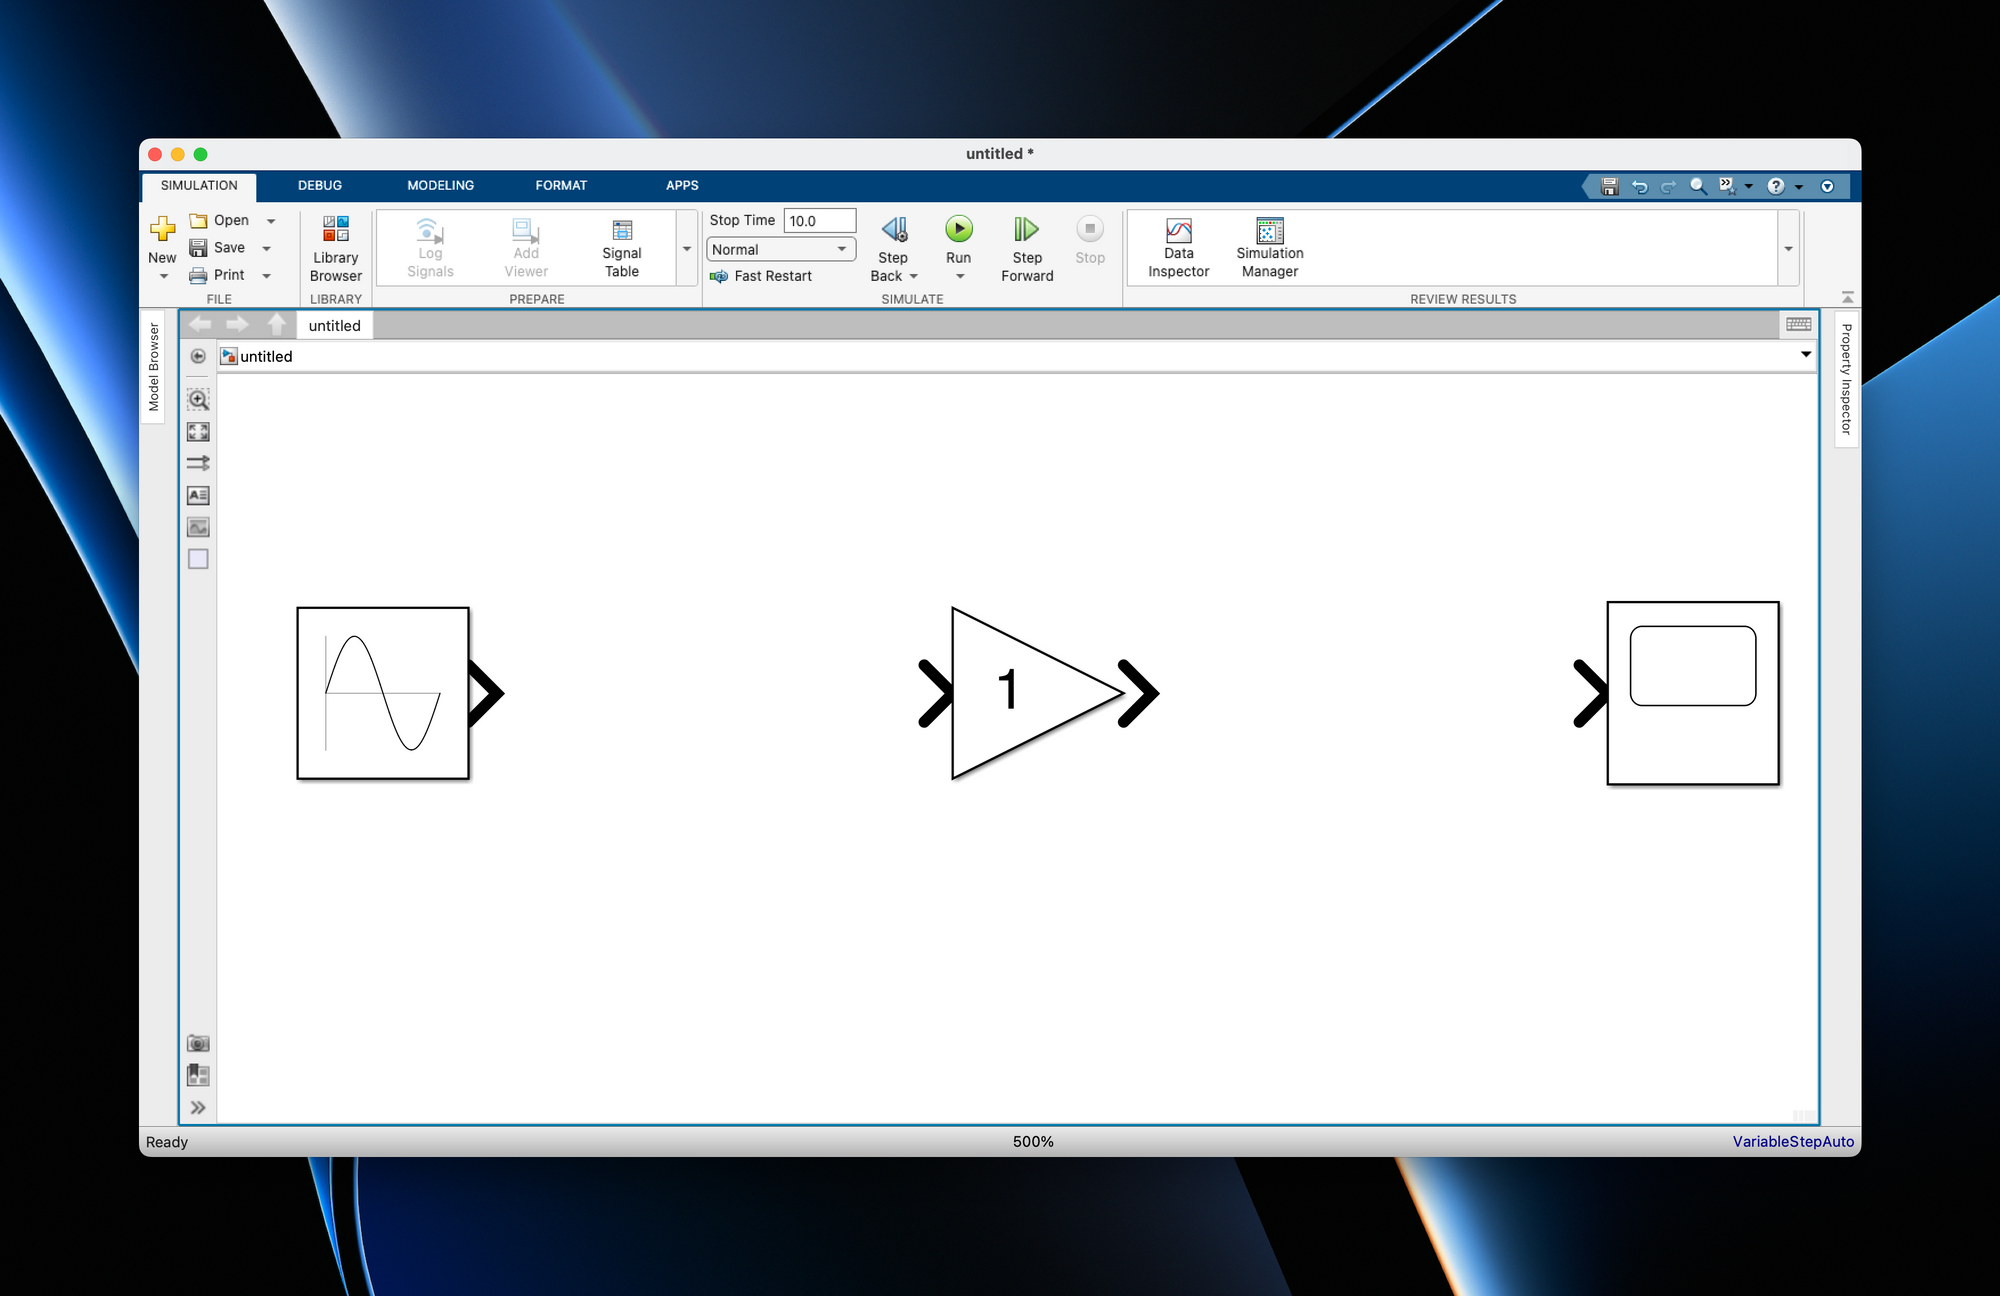
After that we can connect the blocks. Start by grabbing the left block and connect it to the gain & connect the gain to the scope.
As we do not only want to show the gain but also the normal sine wave, we can create an additional connection.
For MacOS, you can hold CMD+Click on the Connection and then drag the new arrow to the scope.
To make sure we are not showing the same sine wave in the scope, we can now adapt the Gain.
Double-click on the gain and adapt it to a number of your choice. In my case, I am going for 10.
Run the Model 🏃
We can now click on the green button in the toolbar to run the whole Simulink model.
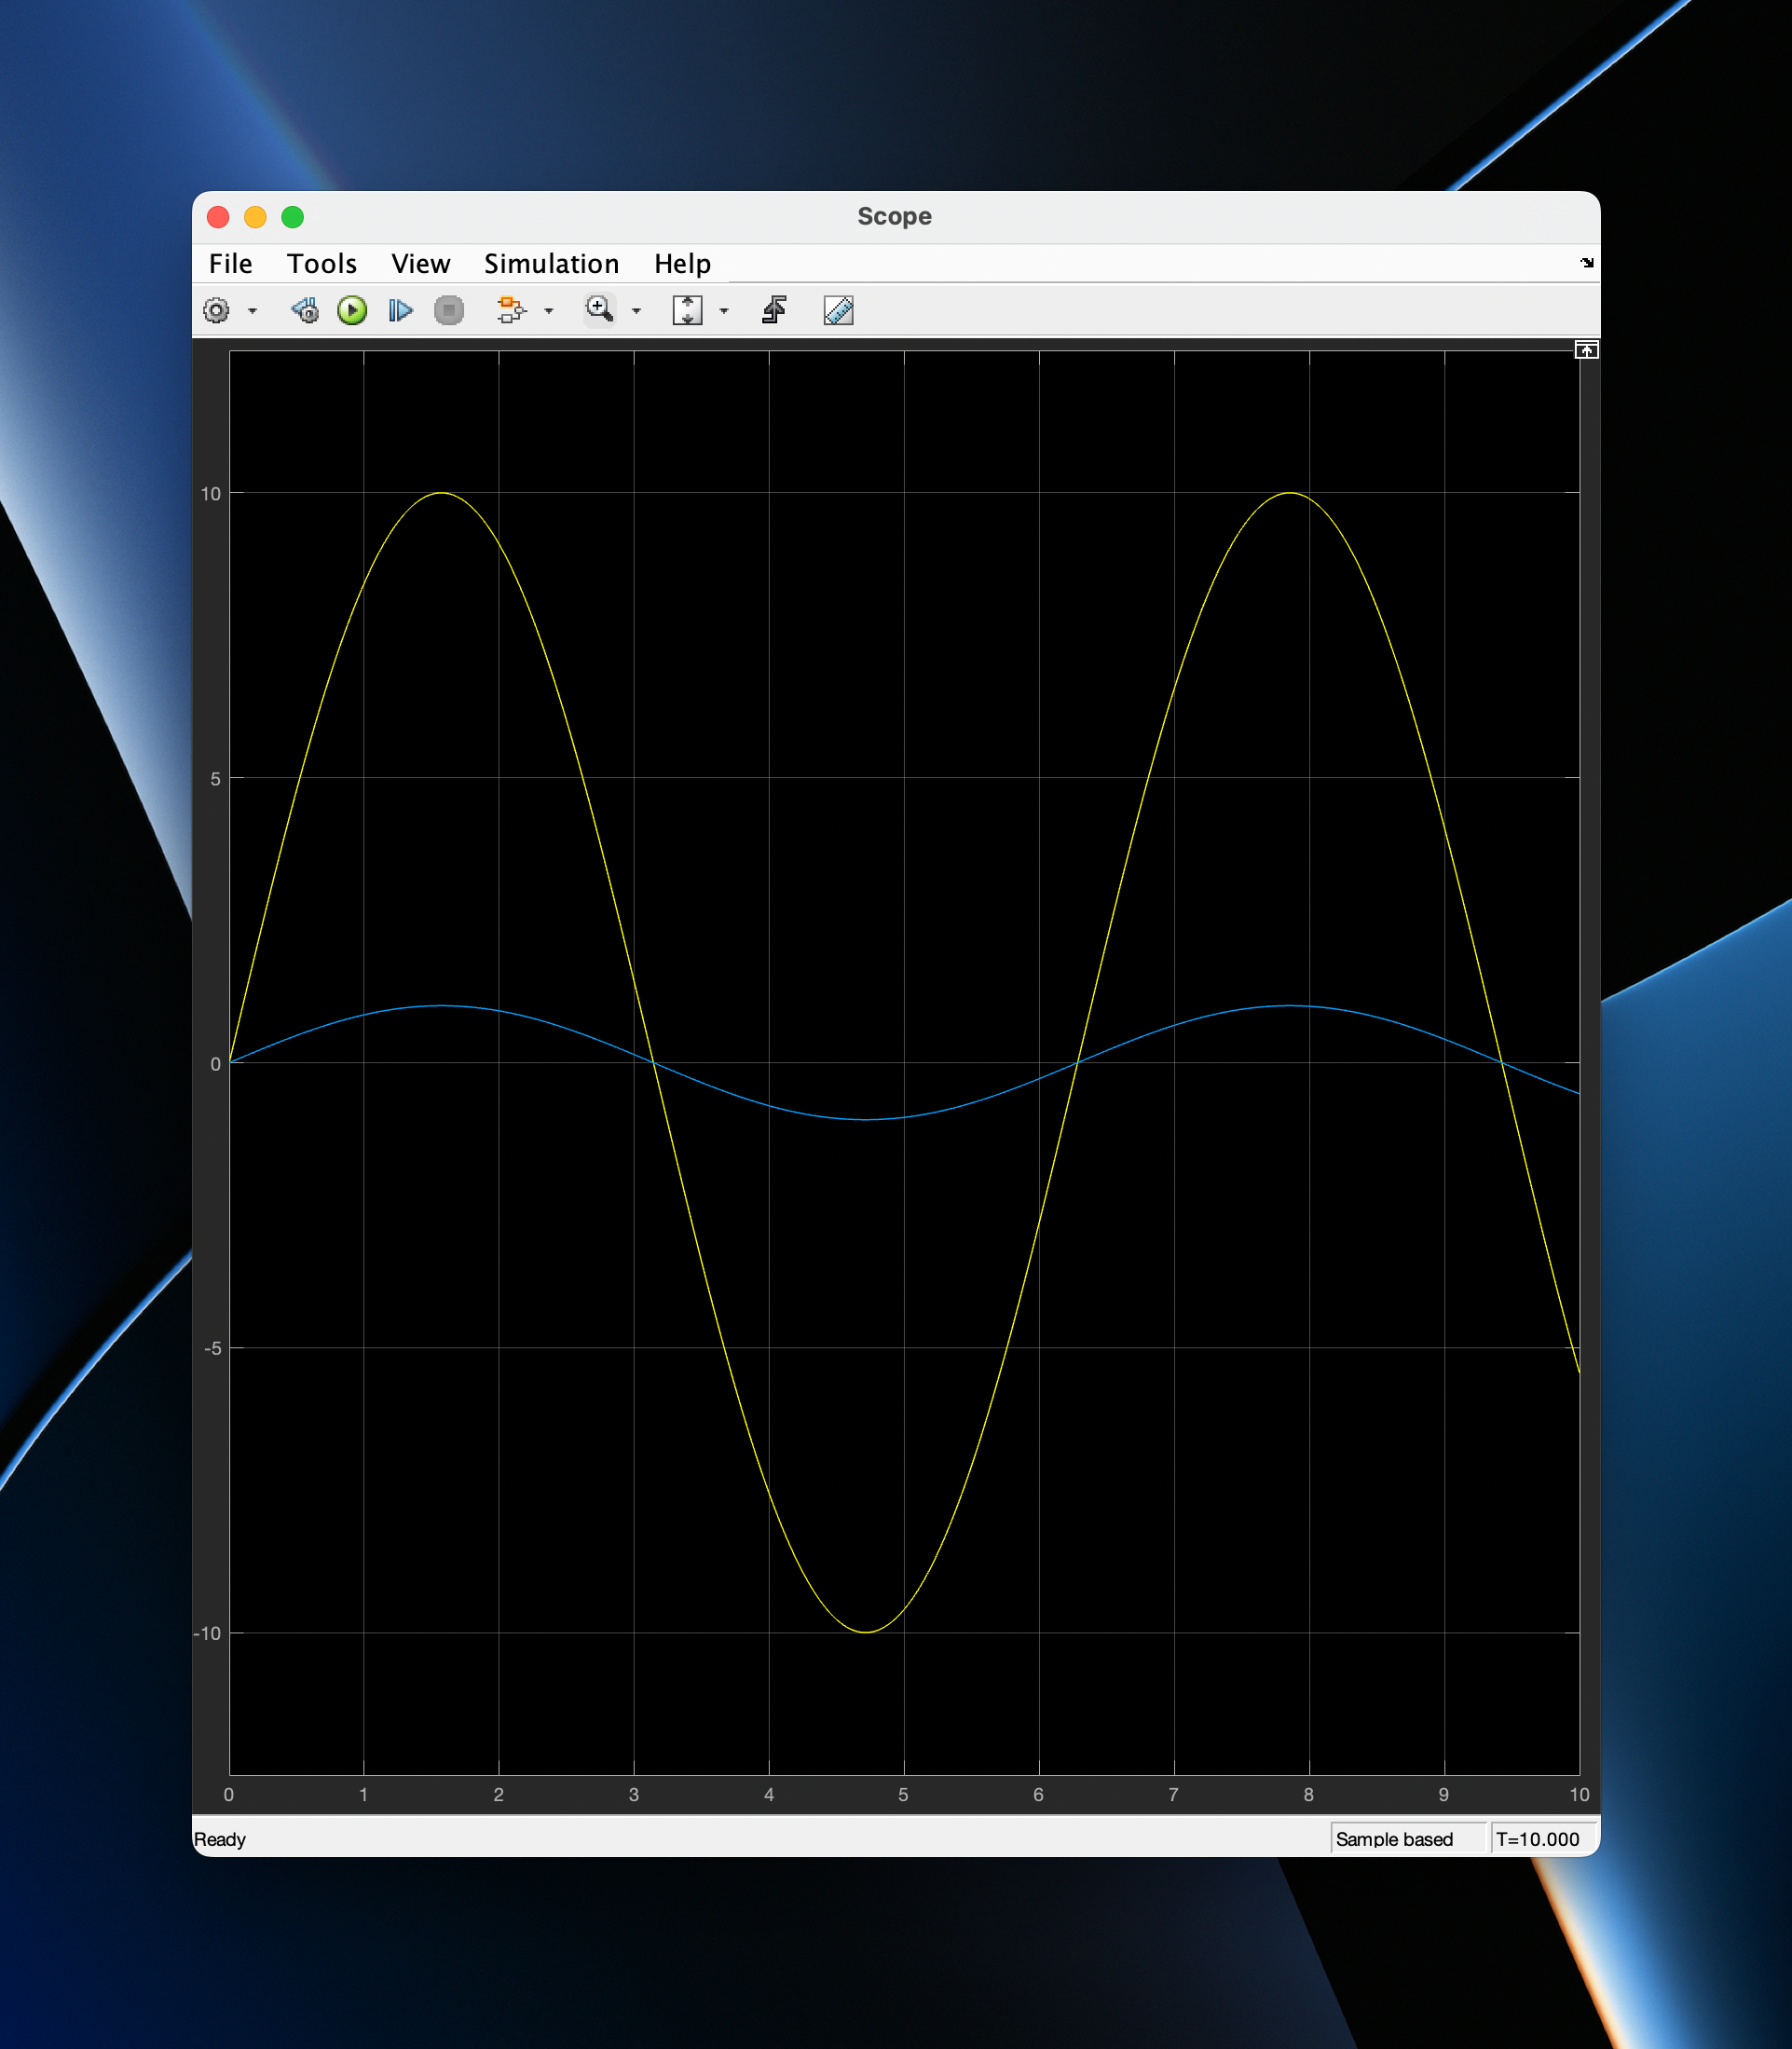
Once you hear a system sound, that's an indicator that the model has finished running. You can now open the plots by double-clicking on the scope.
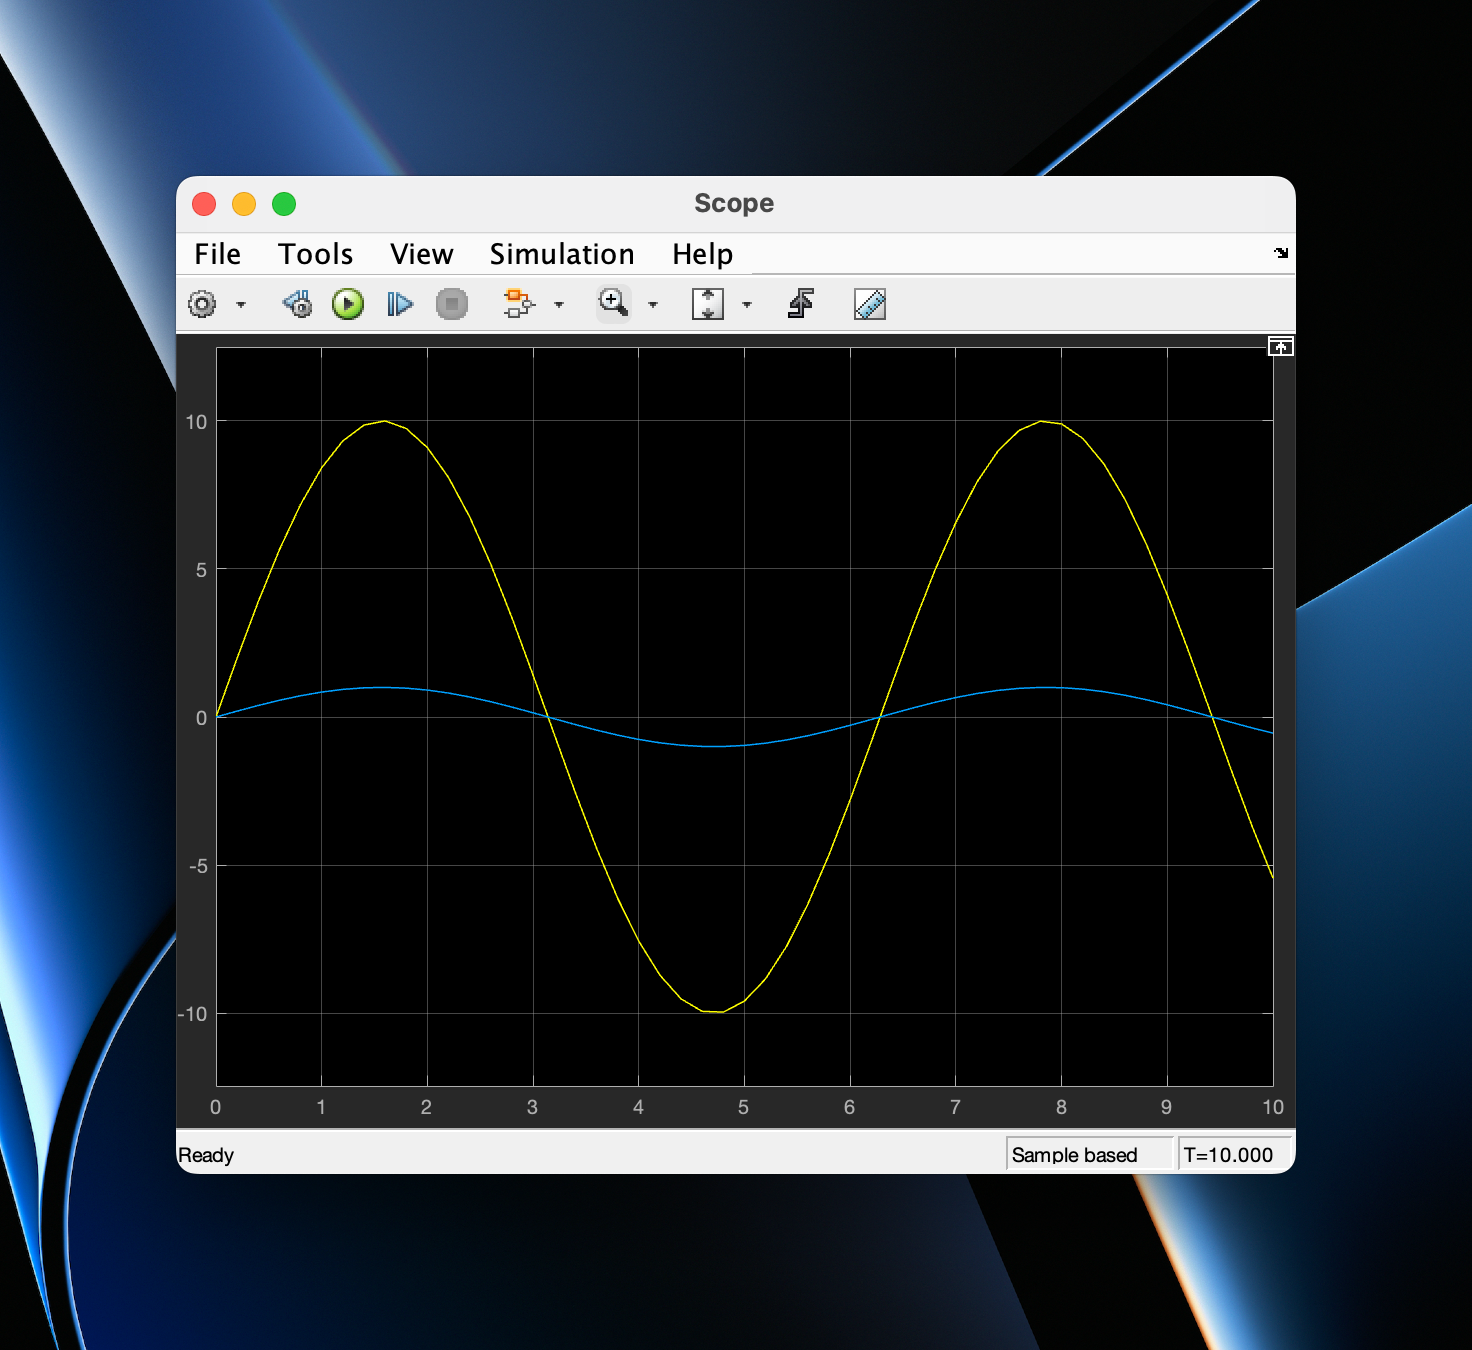
As expected, we can see the normal sine wave in blue and the scaled sine wave in yellow.
Adapt the Solver 💻
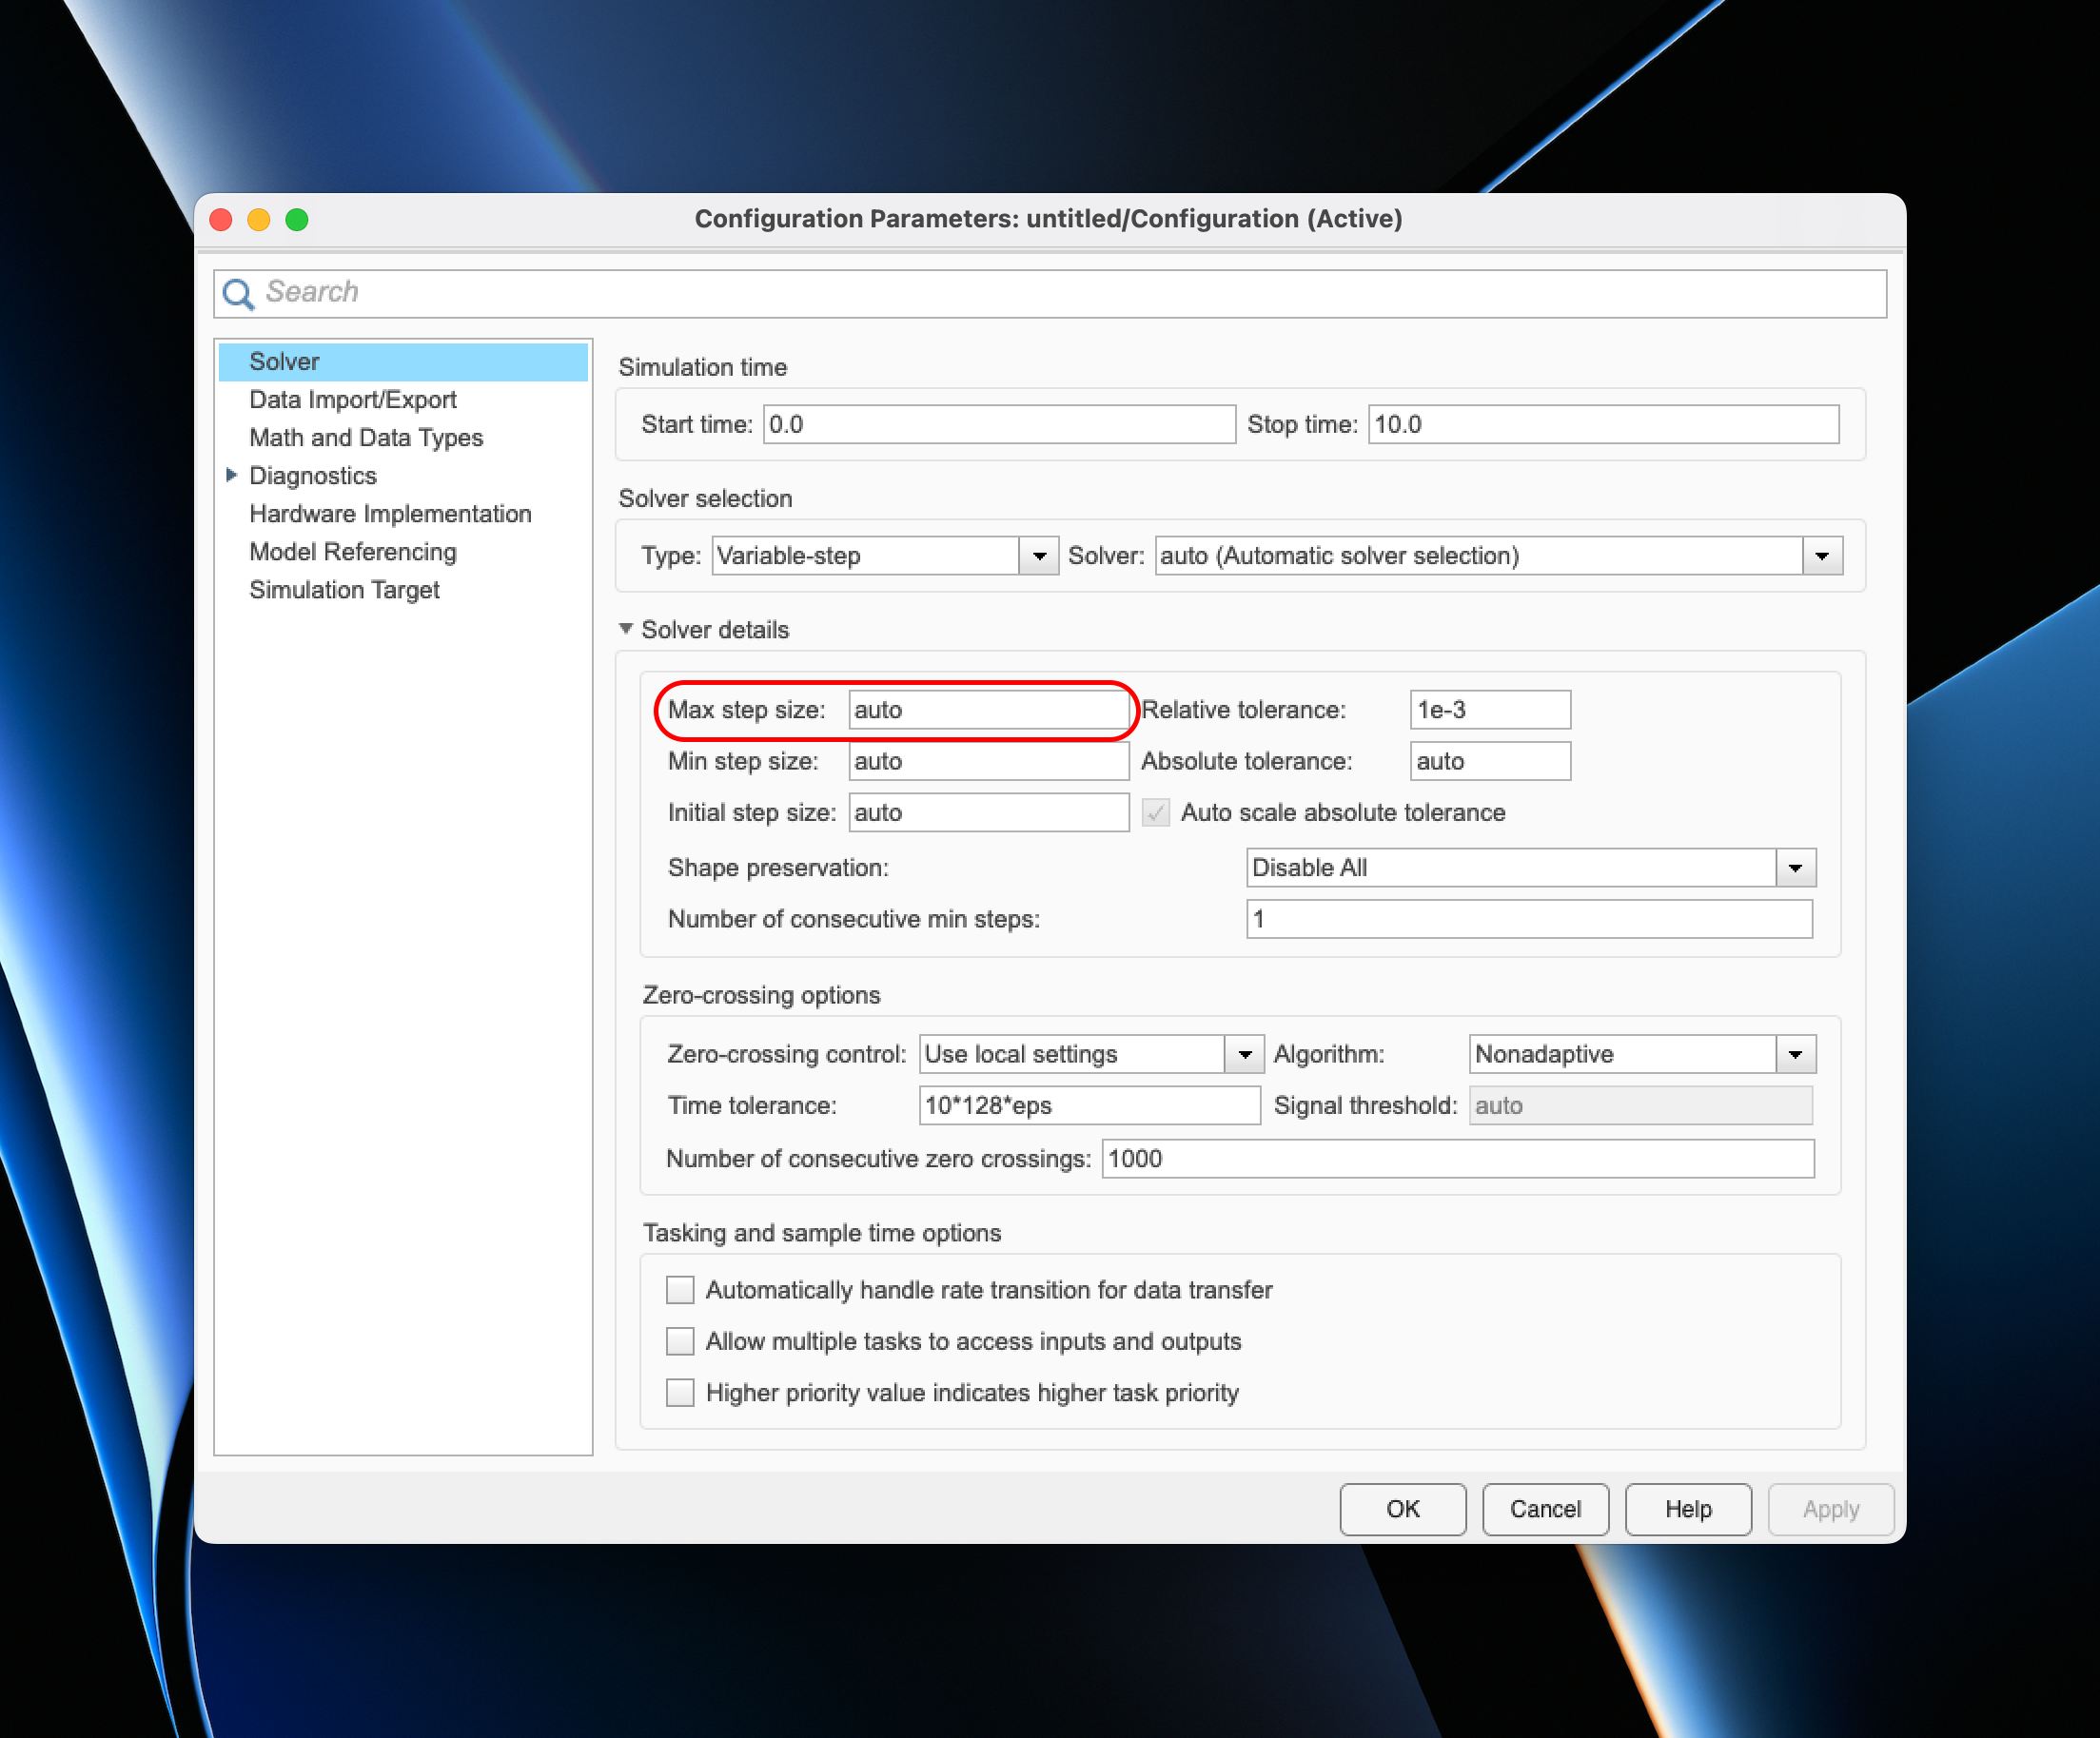
As you can see, the sine wave is not really "smooth". To fix that we right-click in the Simulink window and select "Model Configuration Parameters" or click CMD+E on MacOS.
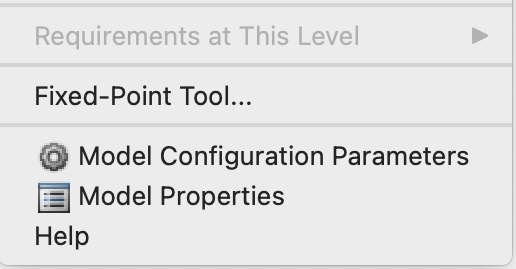
We now have to adapt the "Max step size" from auto to 0.01.
The resulting plot will look way smoother.
That was your first tutorial in Simulink - quick & simple. Hope you liked it! 🙂
If this post was helpful to you, consider subscribing to receive the latest blogs, tutorials and course updates!
And if you would love to see other blog posts or tutorials on MATLAB or Simulink, please leave a comment under this post - cheers!
Keep engineering your mind! ❤️
Jousef